spring-boot-log4j-2-scaffolding
![]()
This project is a simple scaffolding for a Spring Boot application that uses Log4j 2 for logging and Elastic Stack for processing log entries.
To learn how to set up a project like this one, check out the following posts:
- Spring Boot Log4j 2 advanced configuration #1 - saving logs to files
- Spring Boot Log4j 2 advanced configuration #2 - add a Rollover Strategy for log files
- Processing logs with Elastic Stack #1 - parse and send various log entries to ElasticSearch
- Processing logs with Elastic Stack #2 - configure Kibana
- Monitoring Elastic Stack
- How to make one Docker container wait for another
- Monitoring Spring Boot projects with Actuator
- Monitoring Spring Boot projects with Prometheus
- Run a Spring Boot app in a Docker container
- How to set up Grafana with Docker and connect it to Prometheus
- Grafana provisioning – How to configure data sources and dashboards
Getting Started
To clone the repository, run in the command line:
$ git clone https://github.com/little-pinecone/spring-boot-log4j-2-scaffolding.git
You can build the application with:
$ mvn clean install
Spring security
The application uses Spring Boot security starter. The default credentials are specified in the application.properties file:
UseranmetestPasswordtest
Monitoring Spring Boot with Actuator
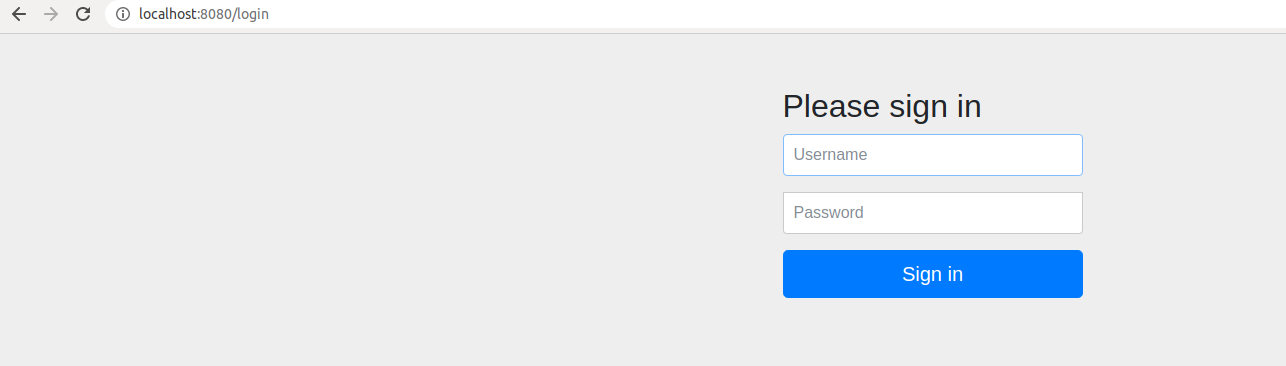
After starting the Spring Boot app, you have to sign in:
Now you can browse the enabled and exposed Actuator endpoints: info, health, metrics.
Run the Spring Boot app, Elastic Stack, Prometheus and Grafana
- Run this application to make sure that the
all.logfile is created and not empty (more than one line is required). - Run the
$ docker-compose up -dcommand in the project directory. The following services should be started:
IMAGE                                     PORTS                                            NAMES
elasticsearch:7.7.0                  0.0.0.0:9200->9200/tcp, 9300/tcp                 springbootelasticstack_elasticsearch_1
logstash:7.7.0                       0.0.0.0:5044->5044/tcp, 0.0.0.0:9600->9600/tcp   springbootelasticstack_logstash_1
kibana:7.7.0                         0.0.0.0:5601->5601/tcp                           springbootelasticstack_kibana_1
springbootelasticstack_filebeat                                                       springbootelasticstack_filebeat_1
springbootelasticstack_metricbeat                                                     springbootelasticstack_metricbeat_1
elastichq/elasticsearch-hq:latest    0.0.0.0:5000->5000/tcp                           springbootelasticstack_elastichq_1
prom/prometheus                      0.0.0.0:9090->9090/tcp                           springbootelasticstack_prometheus_1
grafana/grafana:7.1.3                0.0.0.0:3000->3000/tcp                           springbootelasticstack_grafana_1
springbootelasticstack_app           0.0.0.0:8080->8080/tcp                           springbootelasticstack_app_1
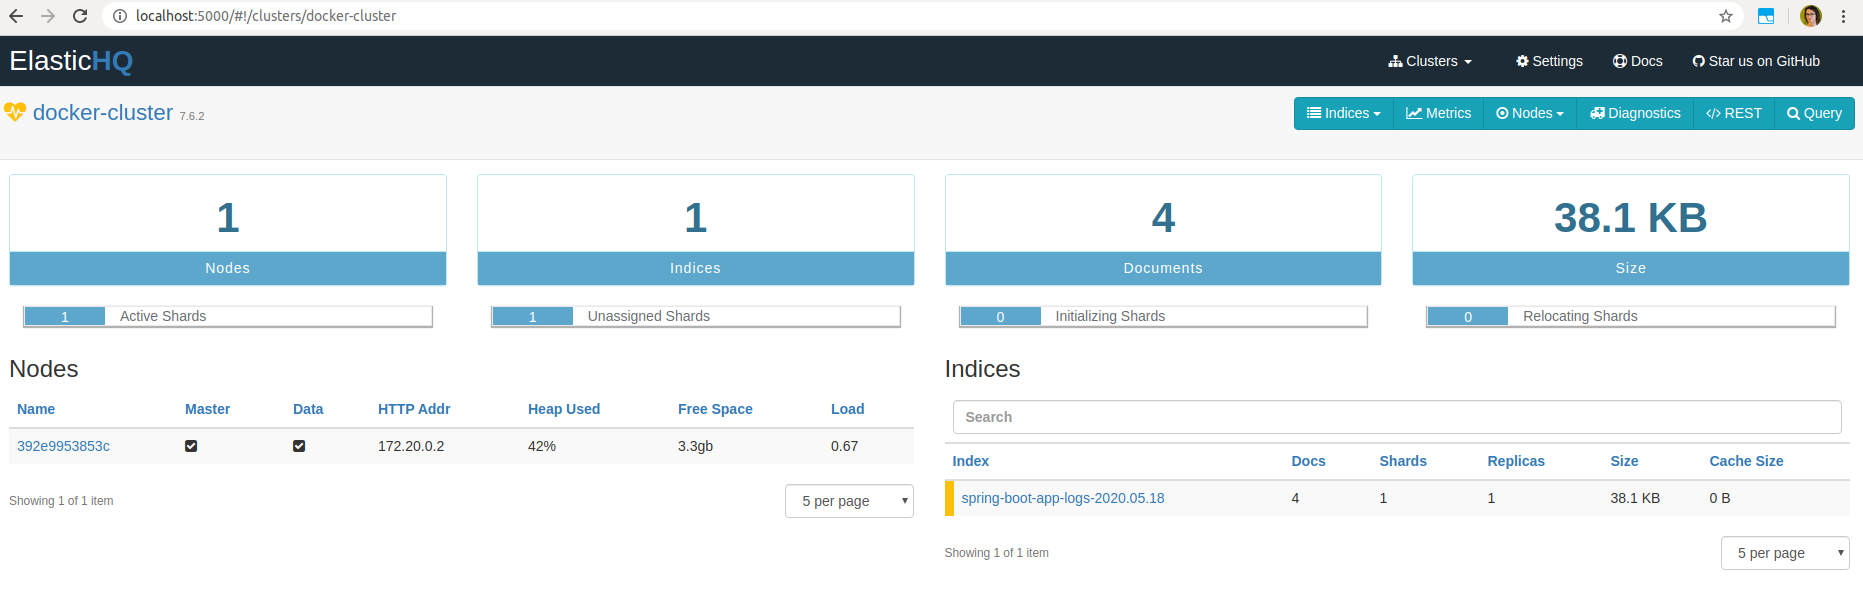
- Visit
http://localhost:5000/#!/to use ElastiHQ interface to verify the content send to Elasticsearch (runQueryfor thespring-boot-app-logs-YYYY.MM.ddindex):
- Visit
http://localhost:5601/to log in to Kibana:
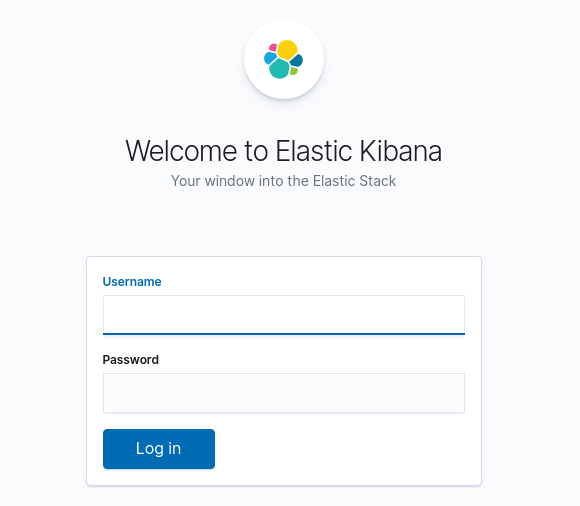
- Use the default username:
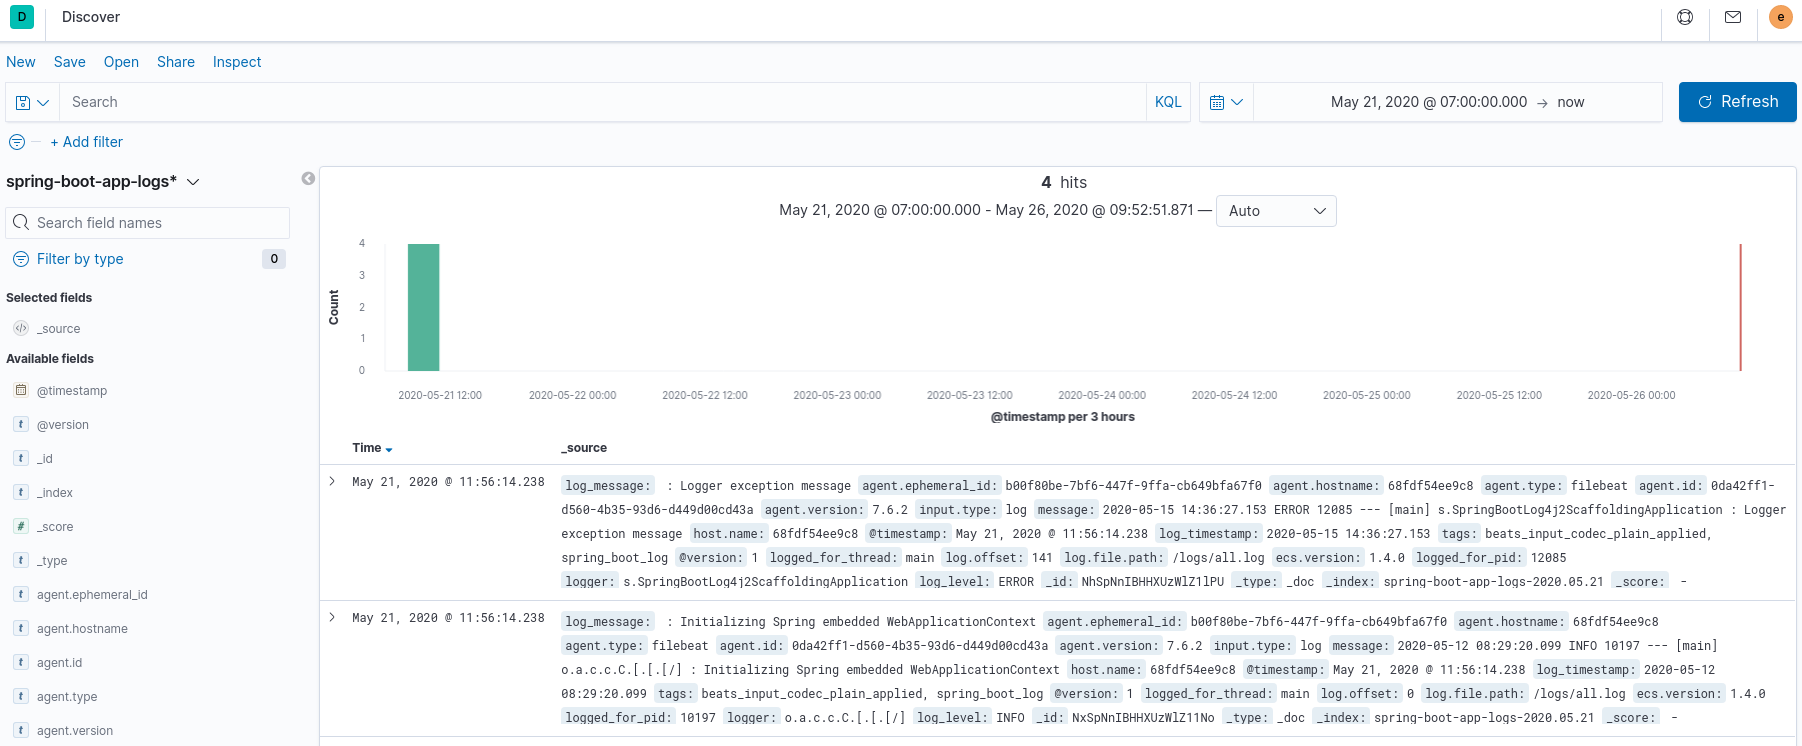
elasticand password:test. - Create
indexdefined in thelogstash.conffile and browse logs accumulated in thelogs/all.logfile (the file is automatically created on the application startup):
- Visit
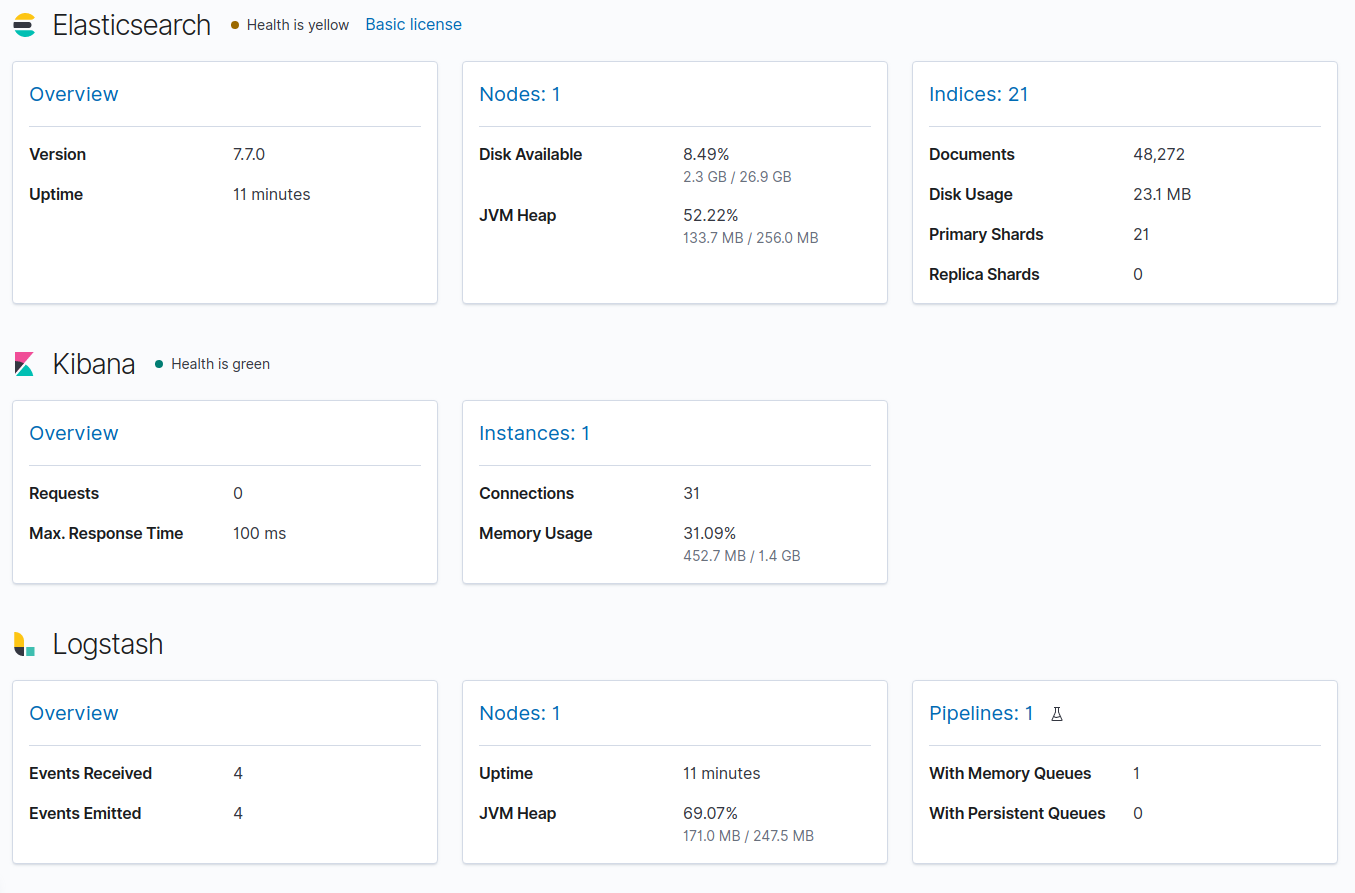
http://localhost:5601/app/monitoringto check out clusters monitoring:
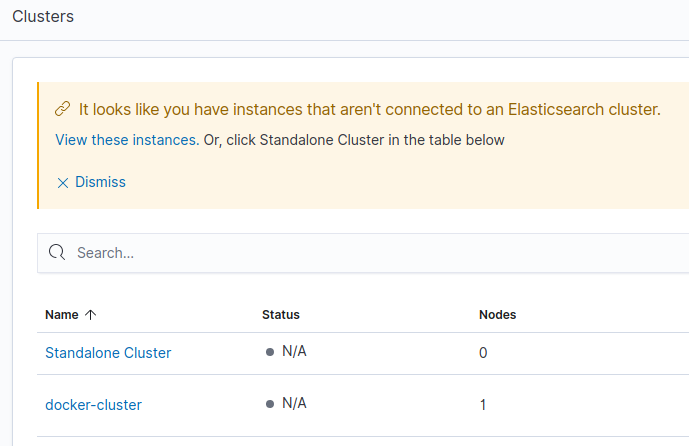
Standalone cluster shows metrics for Filebeat, docker-cluster displays metrics for Elasticsearch, Kibana and Logstash:
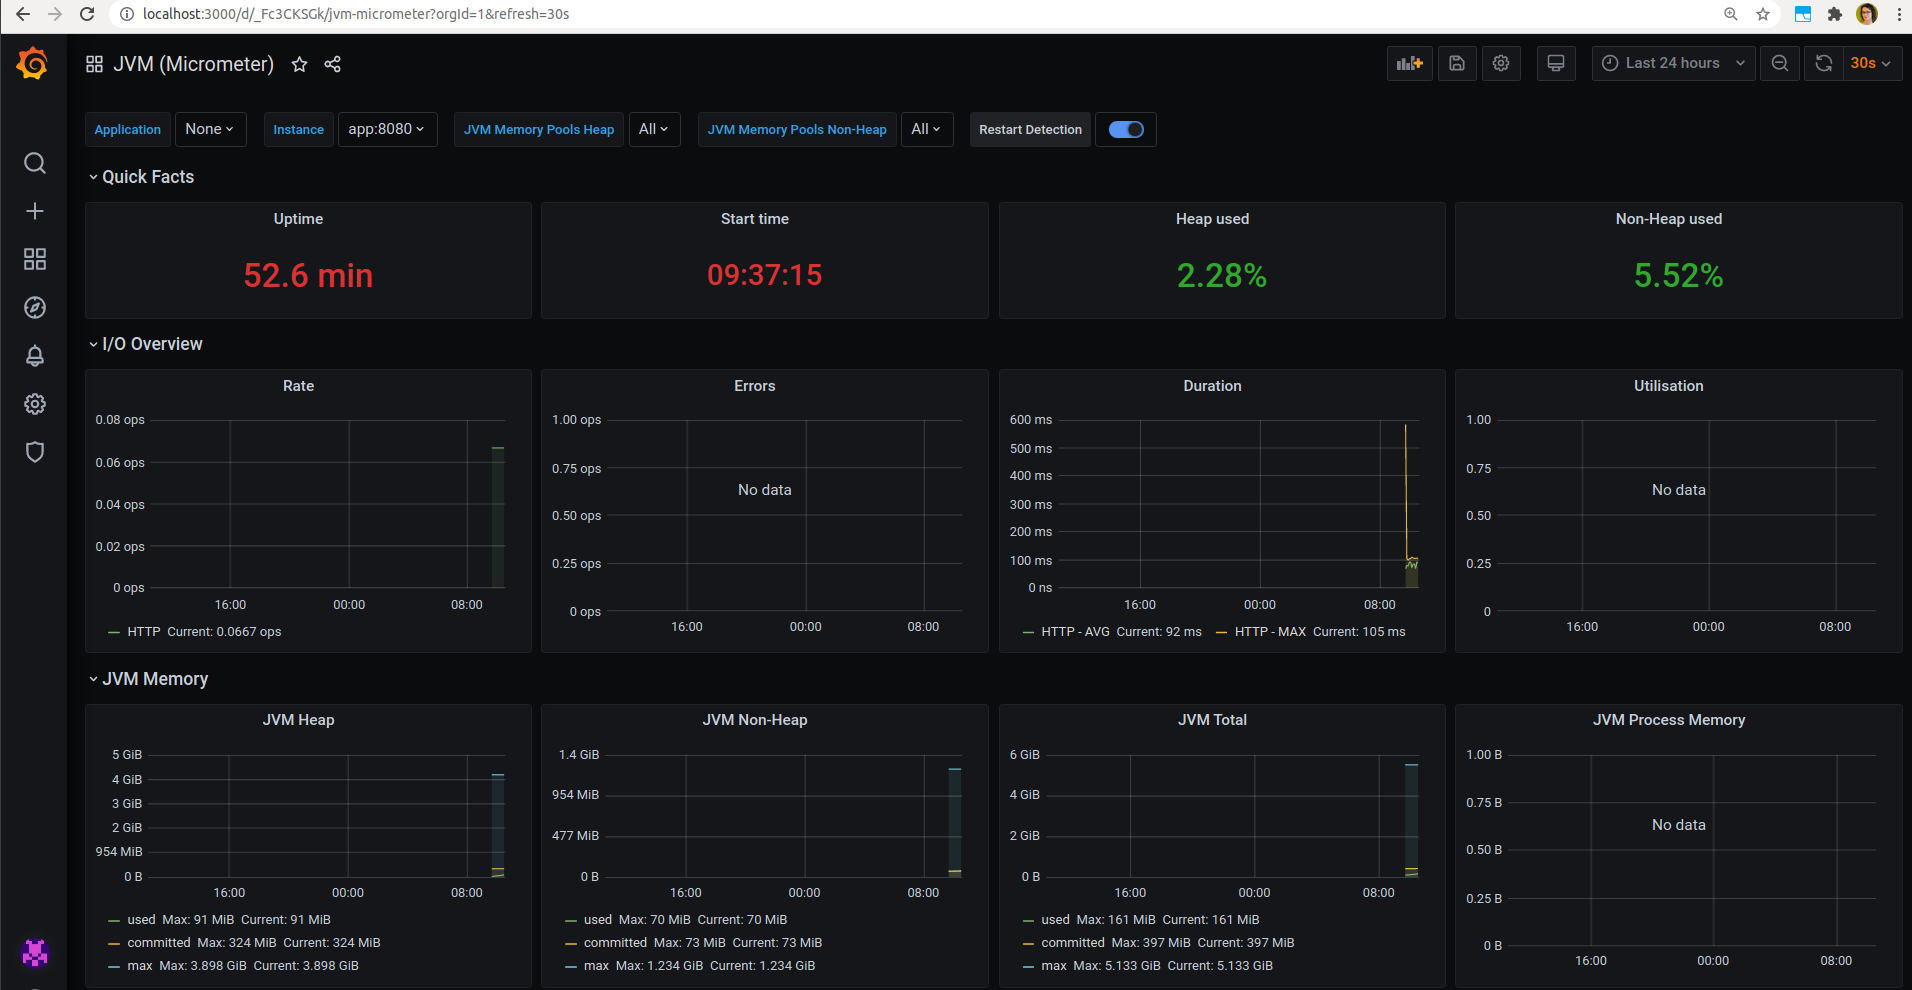
You can also monitor the application state using Grafana:
Overview and technical features
- Log4j 2 is used for logs processing.
- The application uses the
rootlogger and sends log entries toRollingFileandConsoleappenders (when you run the app, thelogsdirectory will be created automatically). - After log entries had been processed by Filebeat and Logstash, they are send to ElasticSearch.
- You can browse logs in Kibana.
- You can browse Elastic Stack metrics in a Kibana dashboard.
- You can monitor the Spring Boot app using Actuator endpoints.
- You can monitor the Spring Boot app using the Prometheus or Grafana dashboards.
- Project documentation
Built With
- Java 11
- Spring Boot 2.2.6
- Docker Compose
- Elastic Stack
- Metricbeat
- Spring Boot Actuator
- Micrometer Prometheus
- Prometheus
- Grafana
- Maven
License
This project is licensed under the Unlicense - see the license details.